
Detailed Analysis of the Ganse Vallei Waste Water Treatment Works by Bill Alexander
· PBRRA
1. Assessment of the Influent Load
The influent data is presented and discussed below:
1.1. Flow Rate
The daily inflow rate into the works is presented below.
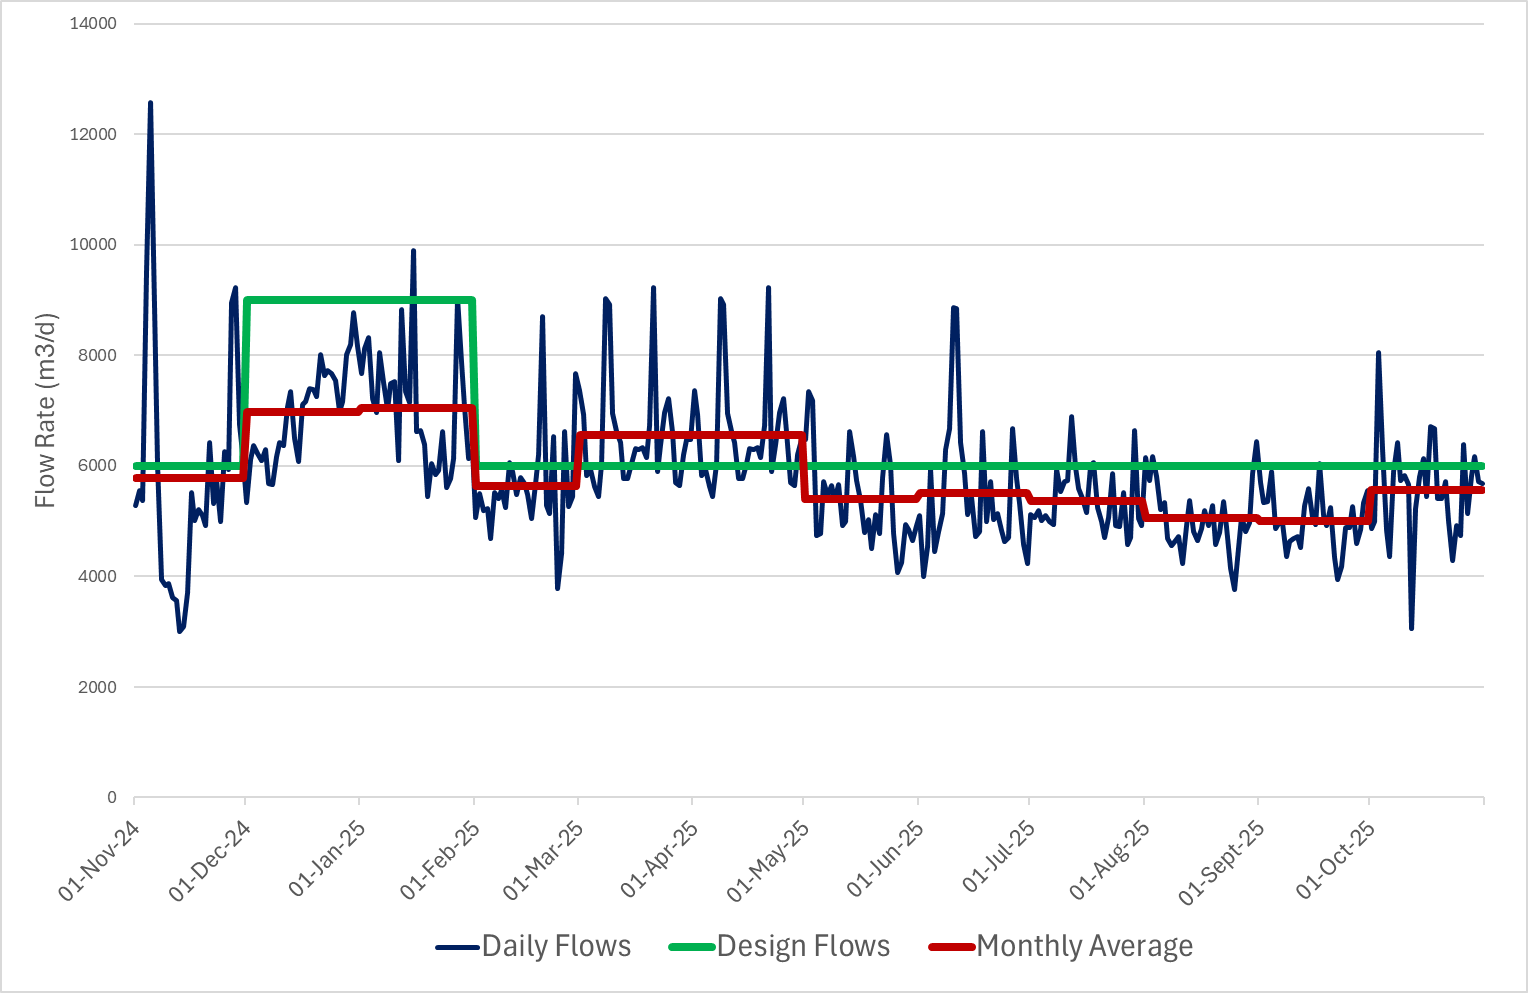
Figure 1: Daily Inflow Rate over the Period
The following should be noted:
- The data is relatively consistent which is expected as the flow rate is measured electronically and is therefore not prone to error. The regular peaks indicate rainfall events.
- The original design allowed for the flow to increase from 6Ml/d to 9Ml/d for the short period over November and December, but the sustained capacity was designed for 6Ml/d.
- As would be expected the flow over December and January are significantly higher than for the rest of the year.
- The high average flows in March and April are due to regular rainfall events.
- The out of season monthly average is approaching the sustained capacity limit.
1.1. COD Concentration and Load
The main determinant of the load on a plant on which its capacity is based is the chemical oxygen demand (COD); this in effect measures the organic load on the plant. The daily load is defined as the average daily COD concentration multiplied by the average daily flow rate.
The chart showing the COD load on the plant is presented in the chart below:
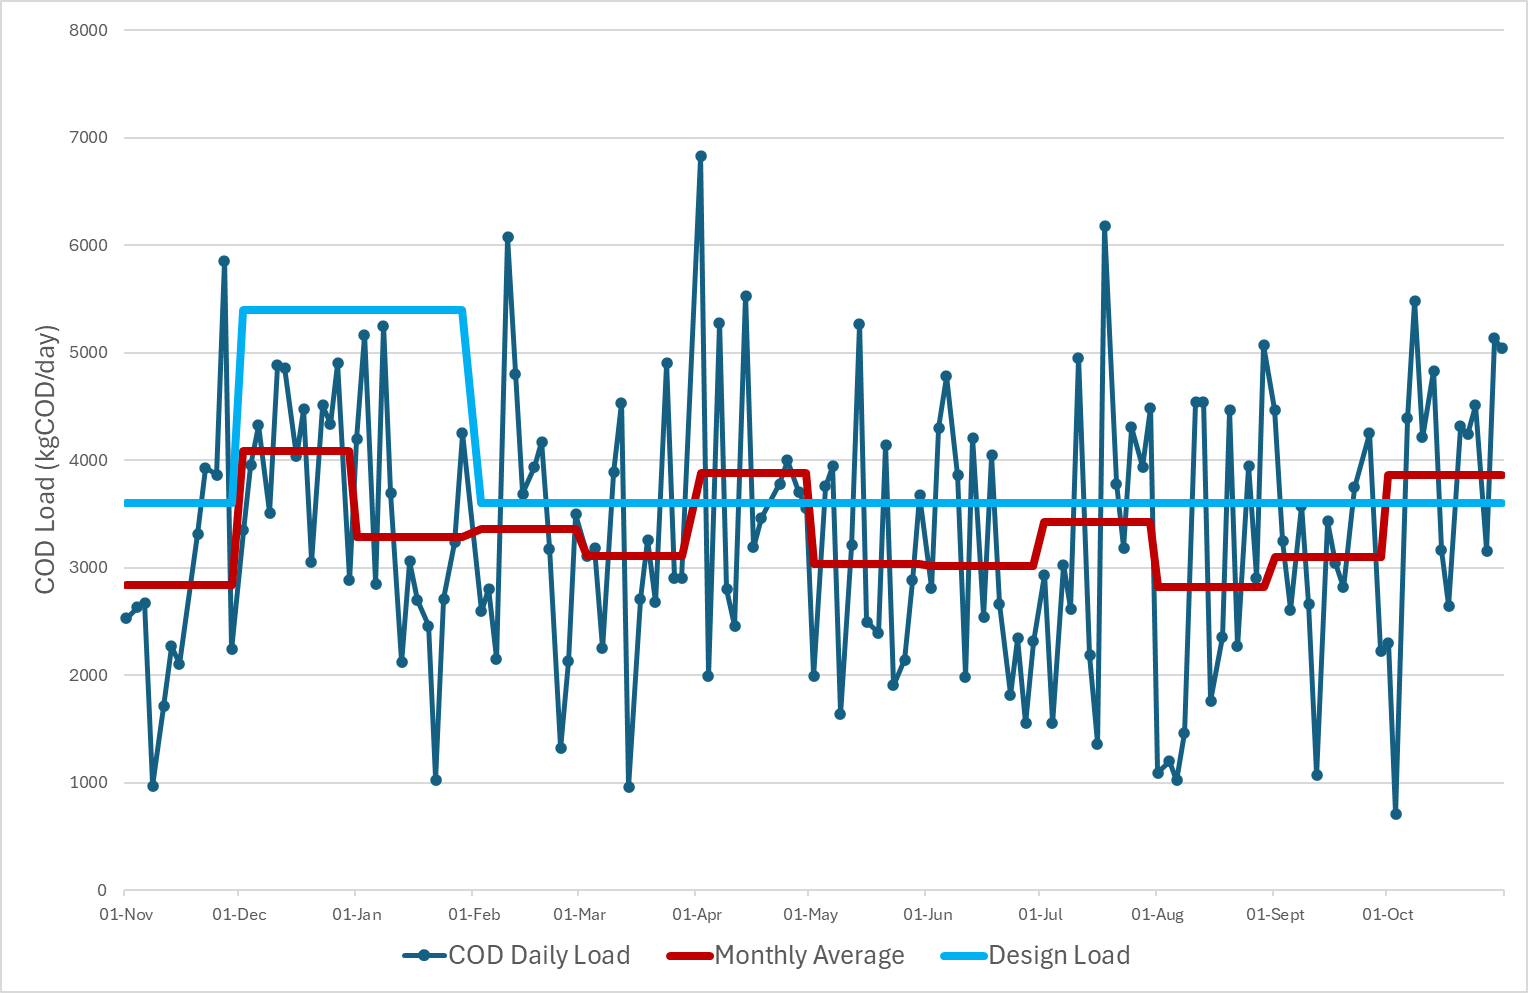
Figure 2: Daily Load over the Period
The following should be noted:
- There is a significant amount of scatter in the data which indicates that the COD concentrations are relatively unreliable.
- The monthly average values are approaching the sustainable design load
However, an exercise to estimate the number of population equivalents this loading represents by conservatively dividing the measured load by the universally accepted lower limit of the mass of COD produced by a person in a day, namely 100gms, yields some interesting insights.
The number of population equivalents represented by the current COD load on the plant is discussed below.
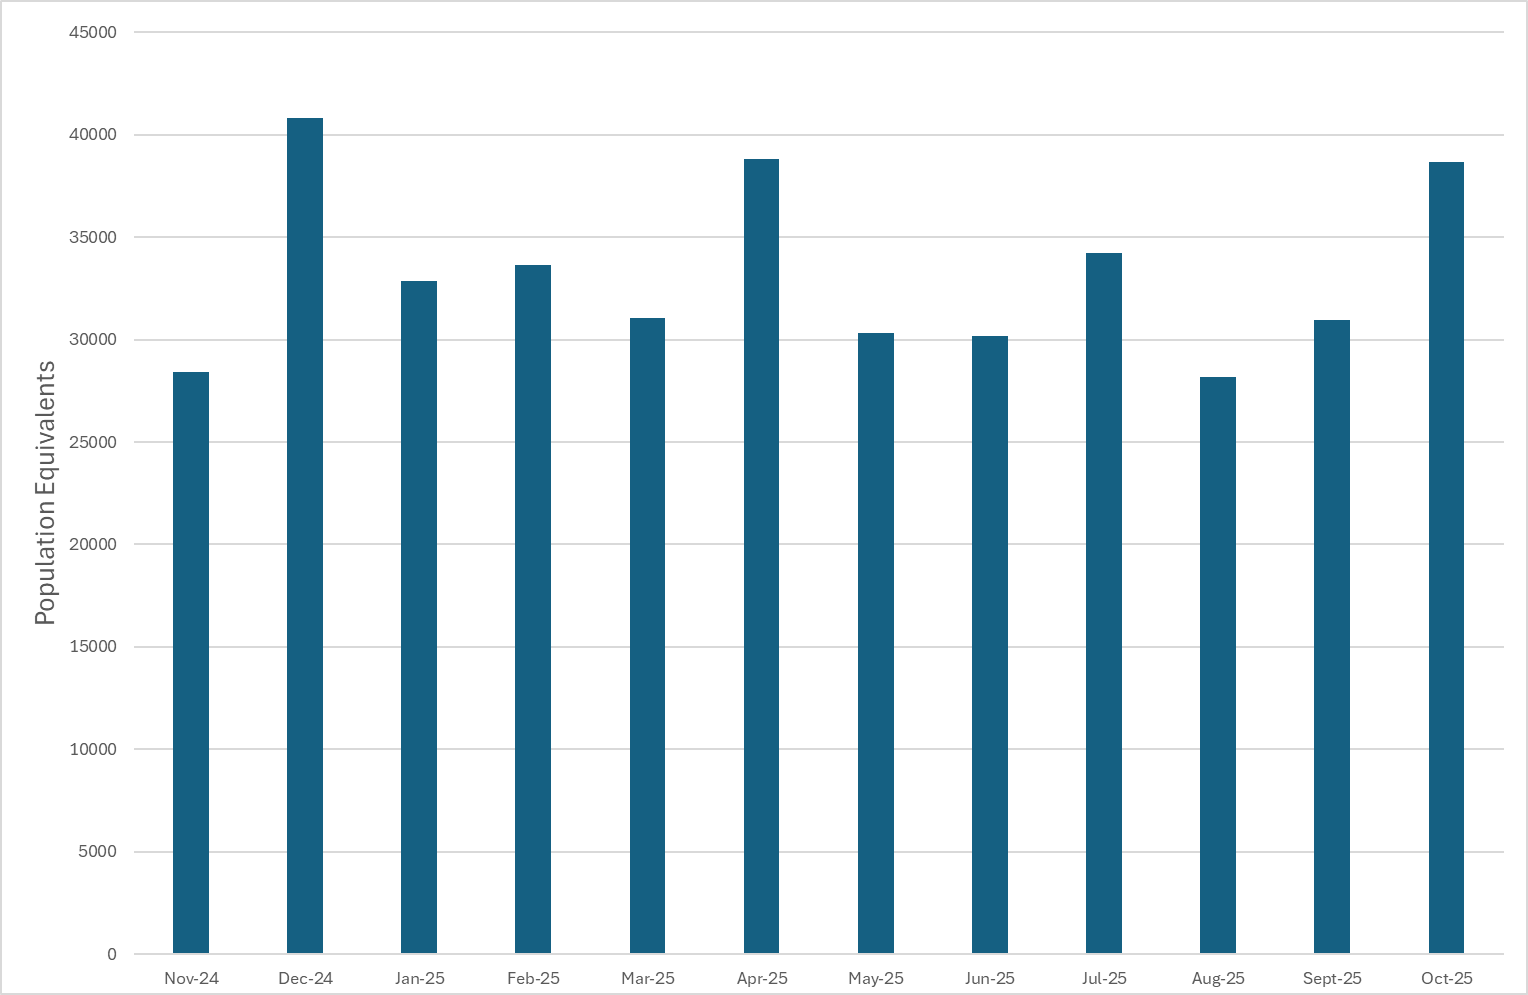
Figure 3: Monthly Average Population Equivalents
Table 1: Estimated Population Equivalents Over the Seasons| Flow | COD | COD Load | Population | |
| Annual Average | 5874 | 575 | 3378 | 33776 |
| Ave March - Sept | 5500 | 582 | 3201 | 32010 |
| Ave Oct -Feb | 6227 | 565 | 3518 | 35183 |
| Peak Season | 7519 | 512 | 3850 | 38497 |
| Ave Design Load | 6000 | 600 | 3600 | 36000 |
| Peak Design Load | 9000 | 600 | 5400 | 54000 |
The following should be noted:
- The out of season population (March – September) appears to be just over 25000 pe whereas the peak population appears to be 38000 pe which is well within the design capacity of the plant.
- However, the recent census has set the permanent population at 75000 pe for the whole of Bitou. Of that, at most 10000 pe will be outside the water supply and sewerage drainage area of the Gansevallei works, leaving at least 60000 pe within it. There thus appears to be a disconnect between the observed plant data and the population data.
To try and establish where the problem lies, the two components of the load, namely the influent rate and the COD concentrations have been analysed.
1.1.1. Flow Measurement
The inflow rate into the works is measured electronically through a Venturi flume and is therefore relatively consistent and can be treated as reasonably accurate as illustrated in Figure 1 above.
1.1.2. The COD concentration
Sampling the influent to a works is a complex business. If one considers that a single grab sample of about 5 litres is taken and analysed and then the results are extrapolated to represent a total daily flow of approximately 6 million litres it is clear that the timing of the sampling is critical and that the data will be inherently inaccurate and inconsistent as is illustrated by the highly scattered data in Figure 2 above.
In order to counteract this, some hourly samples were taken and analysed to establish a profile of COD concentration and load over a day. Samples were taken on the 10/09/2025 and the 17/12/2025 which represent both the out and in season periods. The flow rate was taken over the full 24 hours because it is monitored electronically, but unfortunately the samples were only taken over 12 hours which means that a full profiles and average daily concentrations could not be calculated. However, the data is indicative of trends which are discussed below.
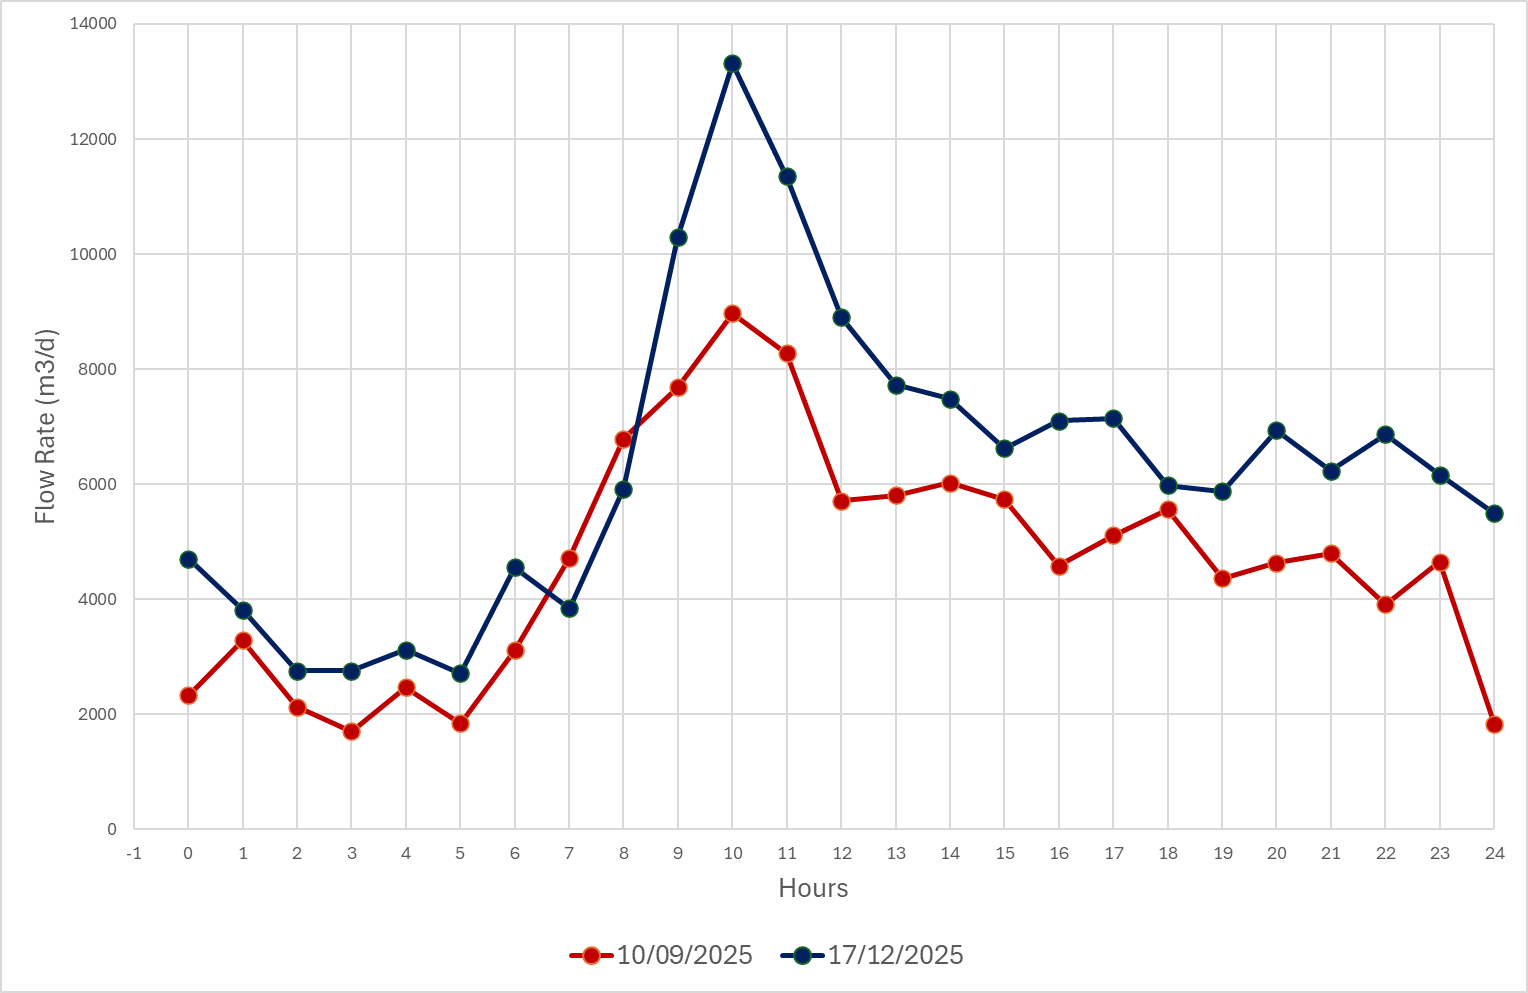
Figure 4: Hourly Flow Profile Over a Day
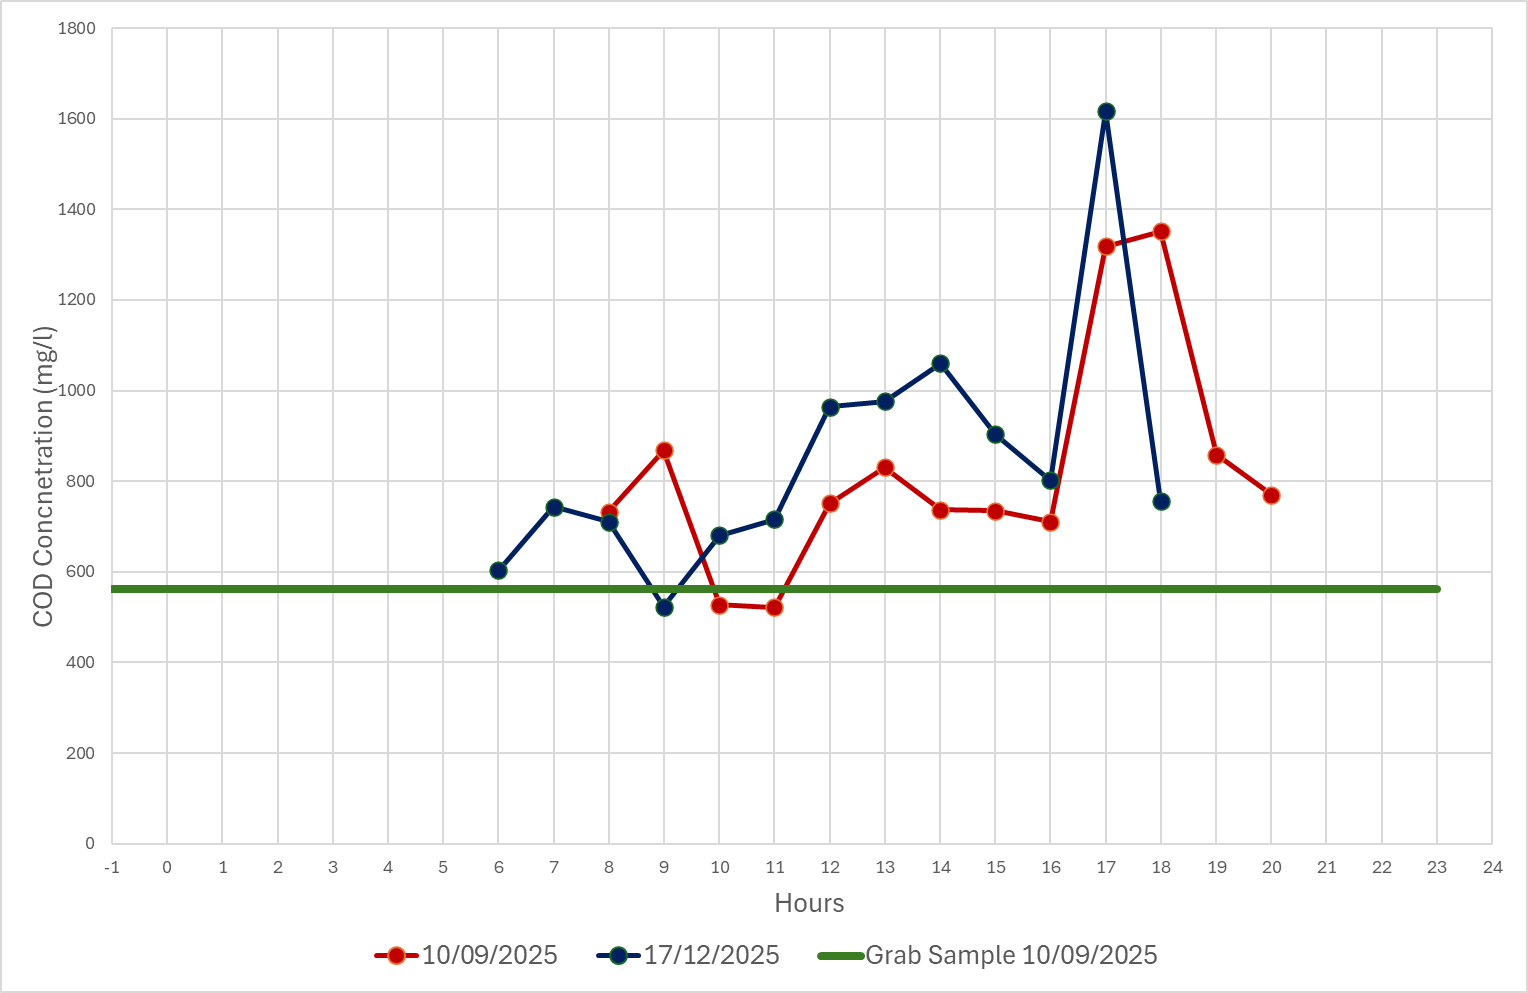
Figure 5: Hourly COD Concentration
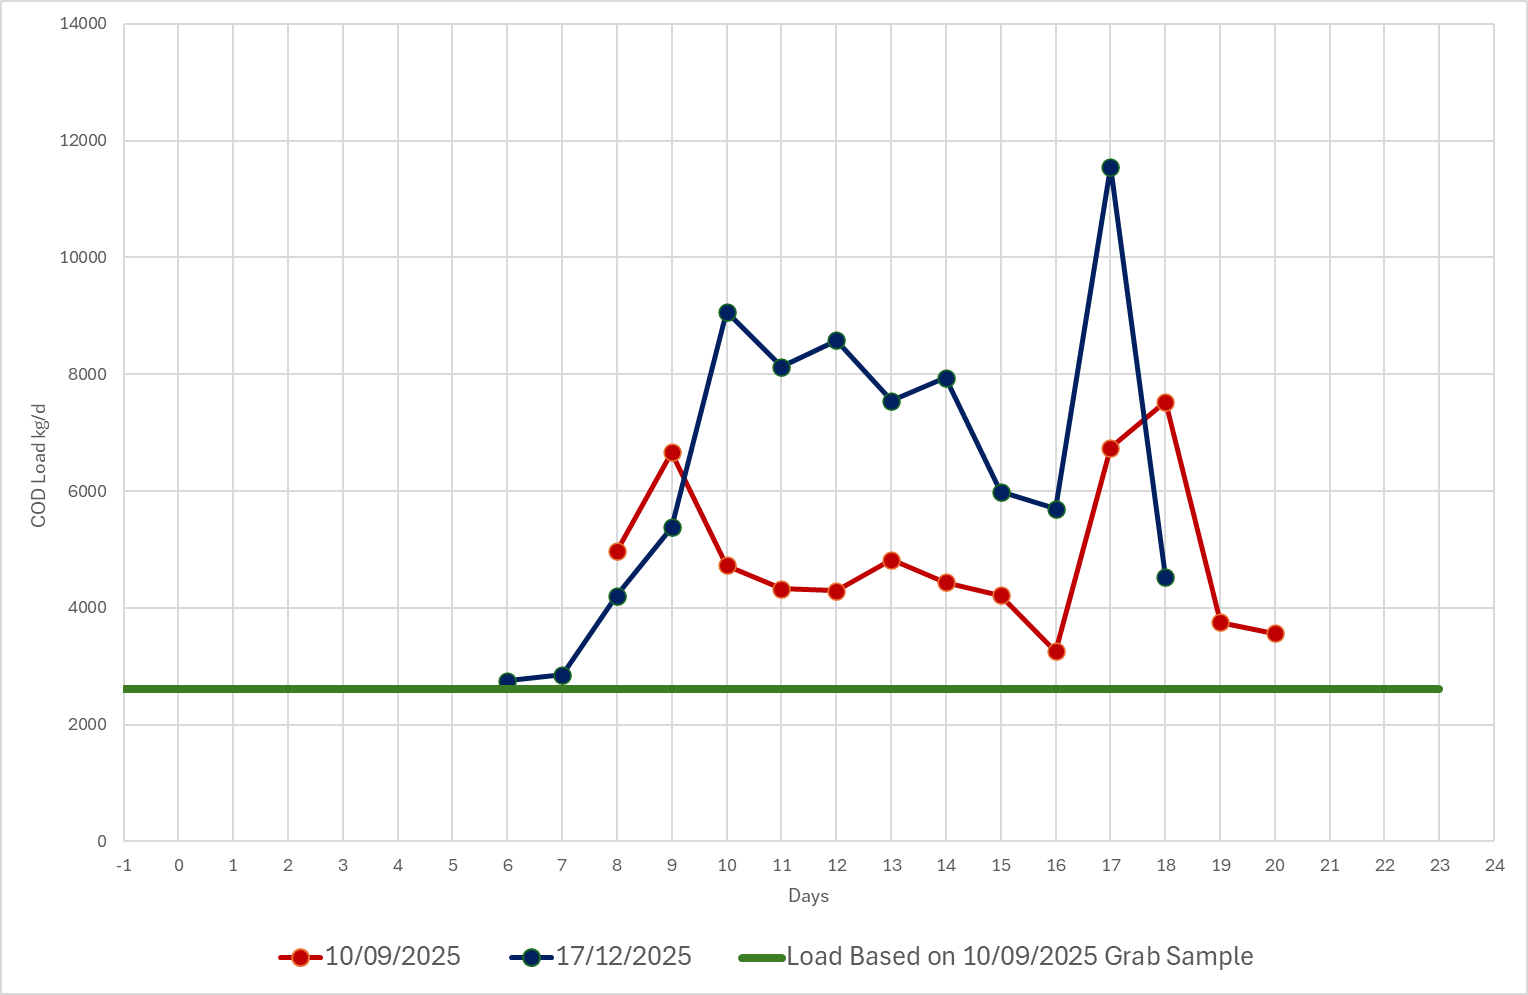
Figure 6: Hourly COD Load
The following should be noted:
- Currently a single grab sample is taken at approximately 7am on sampling days.
- This is before the daily flow increase begins so the flow rate is well below the daily average.
- The COD concentration grab sample taken at 7am on the 10/09/2025 is significantly lower than the concentration in the samples taken later in the day.
- The COD load based on the sample taken at 7am produces a very much lower COD load than those taken later in the day.
- Unfortunately, a grab sample was not taken on the 17/12/2025, but it is highly probable that the result would be similar.
Even though this data is not conclusive because the COD concentrations in samples taken from 8pm to 8am would probably be significantly lower than those taken from 9am to 7pm and would therefore reduce the daily average, it is strongly indicative that the COD concentrations and hence the loads are being significantly under measured by the current method of sampling. This not only presents a false impression about the load on the plant but renders all the money and effort put into the sampling and analysis worthless as all the results are probably significantly inaccurate. It is highly recommended that an automatic sampler that takes representative sample throughout the day be purchased as a matter of urgency so that the true load on the plant can be accurately measured and assessed.
1. Analysis of Effluent Data
The effluent quality currently being generated on the plant is discussed below:
1.1. Introduction
The Google Map image below shows the layout of the works
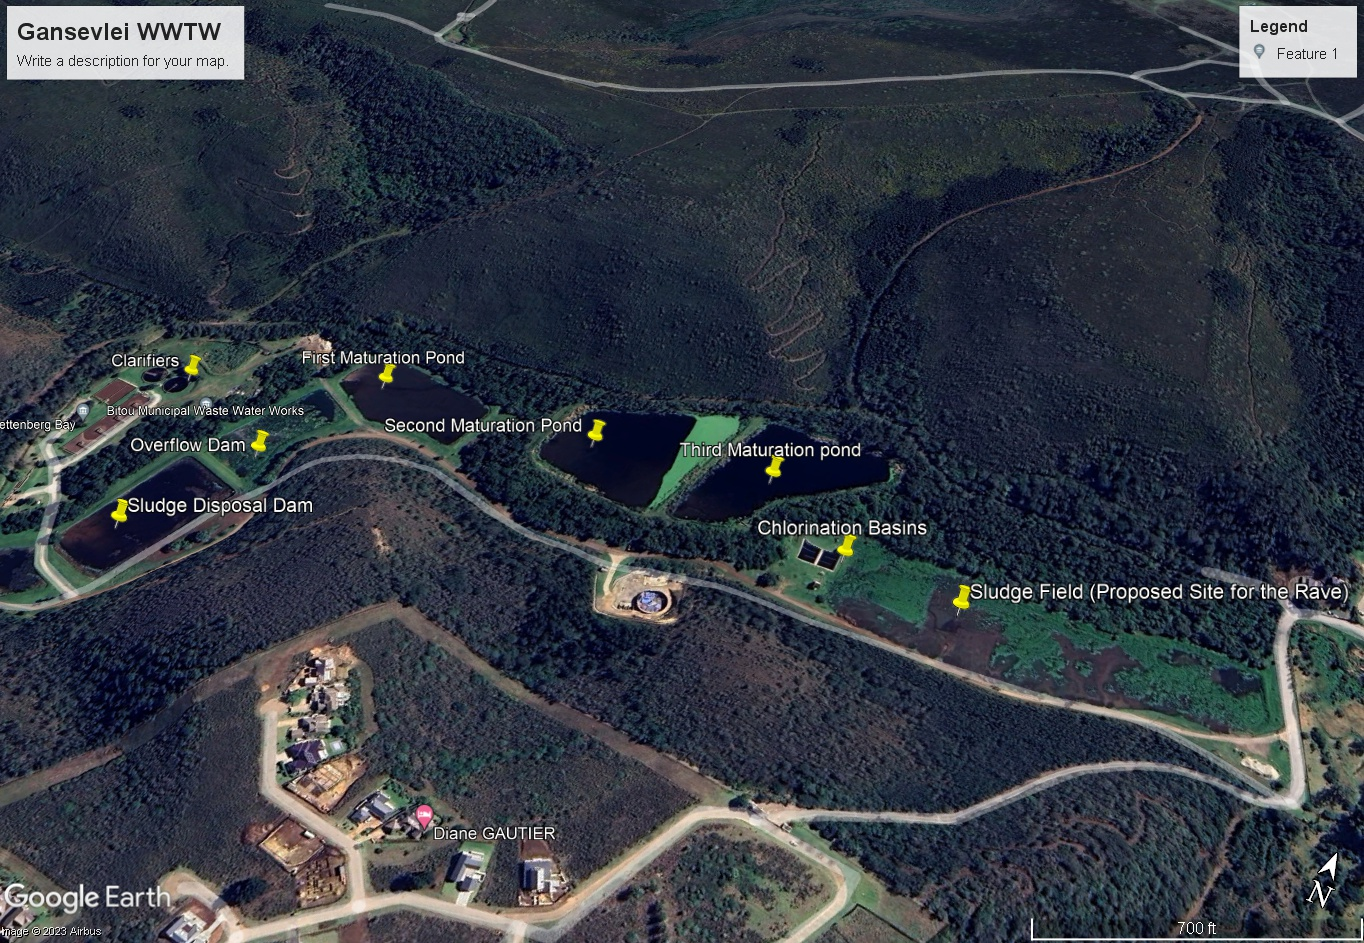
- The effluent from the activated sludge plant itself overflows from the clarifiers and gravitates to a series of three maturation ponds. From there it gravitates to the chlorination basins where it is disinfected before being discharged into the stream leading to the Goose Valley golf course and ultimately to the lagoon.
- The waste activated sludge from the reactor is discharged into the Sludge Disposal Dam where most of the sludge is supposed to settle out. Relatively clear supernatant overflows to the Overflow dam and is pumped from there back into the reactor for retreatment. An emergency overflow weir exists upstream of the plant inlet works where raw sewage can be diverted into the Overflow Dam under emergency conditions and this will be recycled back to the Reactor. There is also an emergency overflow from the Overflow Dam into the First Maturation Pond. The overflow dam is meant to be kept empty so that it has storage capacity for diverted influent in case of an emergency.
- The original design allowed for the sludge in the Sludge Disposal Dam to be pumped to the sludge field to dry out when the dam was full of the sludge; judging from the sludge layer on the field this has been done in the past.
- The objective of the maturation ponds is to balance out any peak concentrations in the pollutants as well as to polish the effluent quality and optimise bacterial and pathogen die-off before the effluent is chlorinated prior to being discharged to the stream.
The plant staff take 3 samples a week of the effluent leaving both the clarifiers and the chlorination basins and these samples are then analysed by the municipal water laboratory. It should be noted that the effluent quality reported to the Department of Water and Sanitation is for the final effluent leaving the plant from the chlorination basins.
1.1.1. Effluent Standards Required
The effluent standards required for the works are presented in the Table below
| Parameter | Current Standard | Special Standard |
| COD | 75mg/l | 35mg/l |
| Ammonia | 6mg/l | 2mg/l |
| Phosphorus | 10mg/l | 1mg/l |
It is probable that the required standards will be decreased from the current standard to the special standard for ammonia and phosphorus when the new water license is issued for the extension to the Works currently being designed. It seems unlikely the COD standard will be decreased because that would require tertiary sand filtration.
1.1.2. Condition of the Maturation Ponds
A site inspection was carried out on the maturation ponds and found that the first pond is full of what appears to be waste activated sludge. The picture below shows the sludge blanket just below the surface of the water in the pond. The verges of the second and third ponds are very overgrown, and it is difficult to get close enough to the edges to do a proper inspection, but the second pond showed evidence of some sludge deposits and the third pond appeared to be relatively clear of sludge.
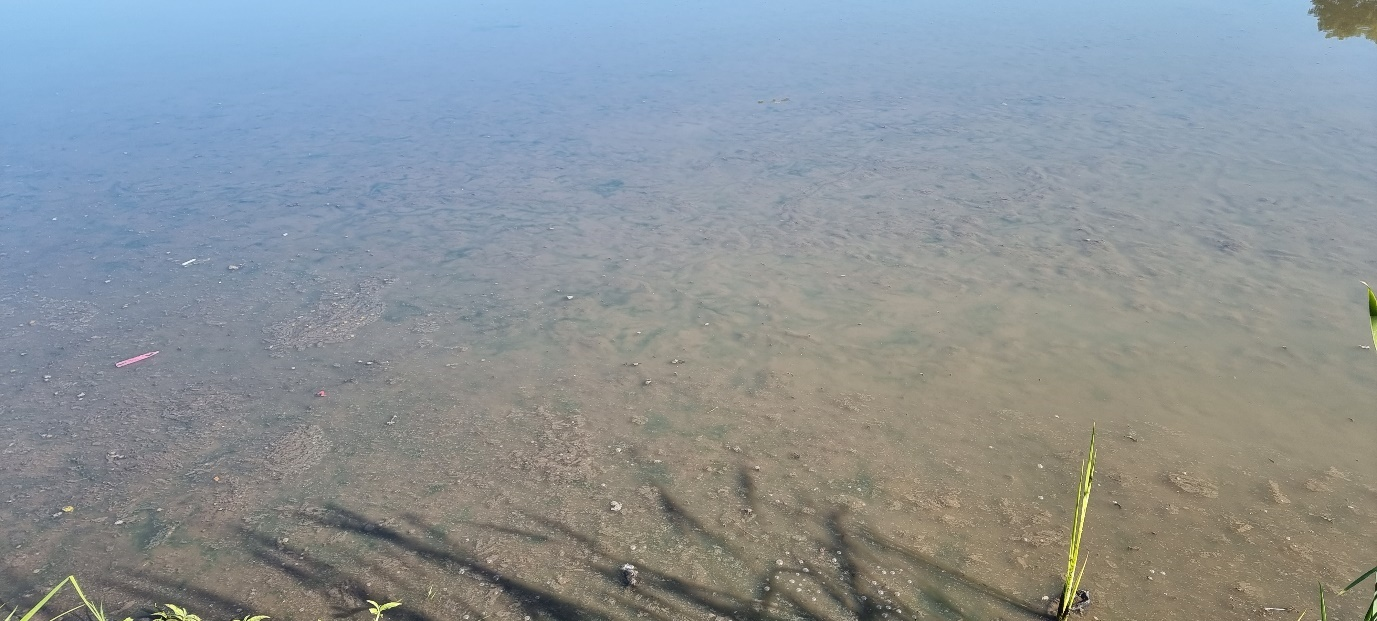
- The sludge in the blanket covering the whole floor of the first pond has significant implications for the final effluent leaving the plant. The organic solids continuously ferment and thereby release COD, ammonia, and phosphorus into the water body and hence into the effluent leaving the pond. It is probable that the effluent leaving the first pond has significantly higher concentrations of ammonia, COD and phosphorus in it, but that the quality is improved in the relatively clean second and third ponds by the removal of ammonia and COD due to natural oxidation. It is less likely that the phosphorus concentration will be reduced in the last two ponds. It has been suggested to the operating staff that regular samples of the effluent be taken from each of the maturation ponds so that it can be establish where the bulk of the pollution of the effluent is taking place.
- It would appear that this situation has arisen because in the past the Sludge Disposal dam was not emptied when full and the sludge overflowed into the Overflow Dam and from there into the First Maturation Pond. The Sludge Disposal and the Overflow Dams have recently been cleaned out, with the sludge being spread on the sludge field. However, the maturation pond was not cleaned at the same time.
It is clearly unacceptable for a maturation pond to be full of sludge leading to the polluting of the clarifier effluent and in turn leading to excessive chlorine requirements and eutrophication of the receiving stream and possibly the lagoon. The solution to this would be to empty the sludge from the pond and deposit it on the sludge field for it to dry out as was originally envisaged. An attempt was made to do this over the past year, but a satisfactory method of achieving it could not be found within the existing budget constraints.
1.1.1. Effluent COD
The COD effluent data is presented in the chart below:
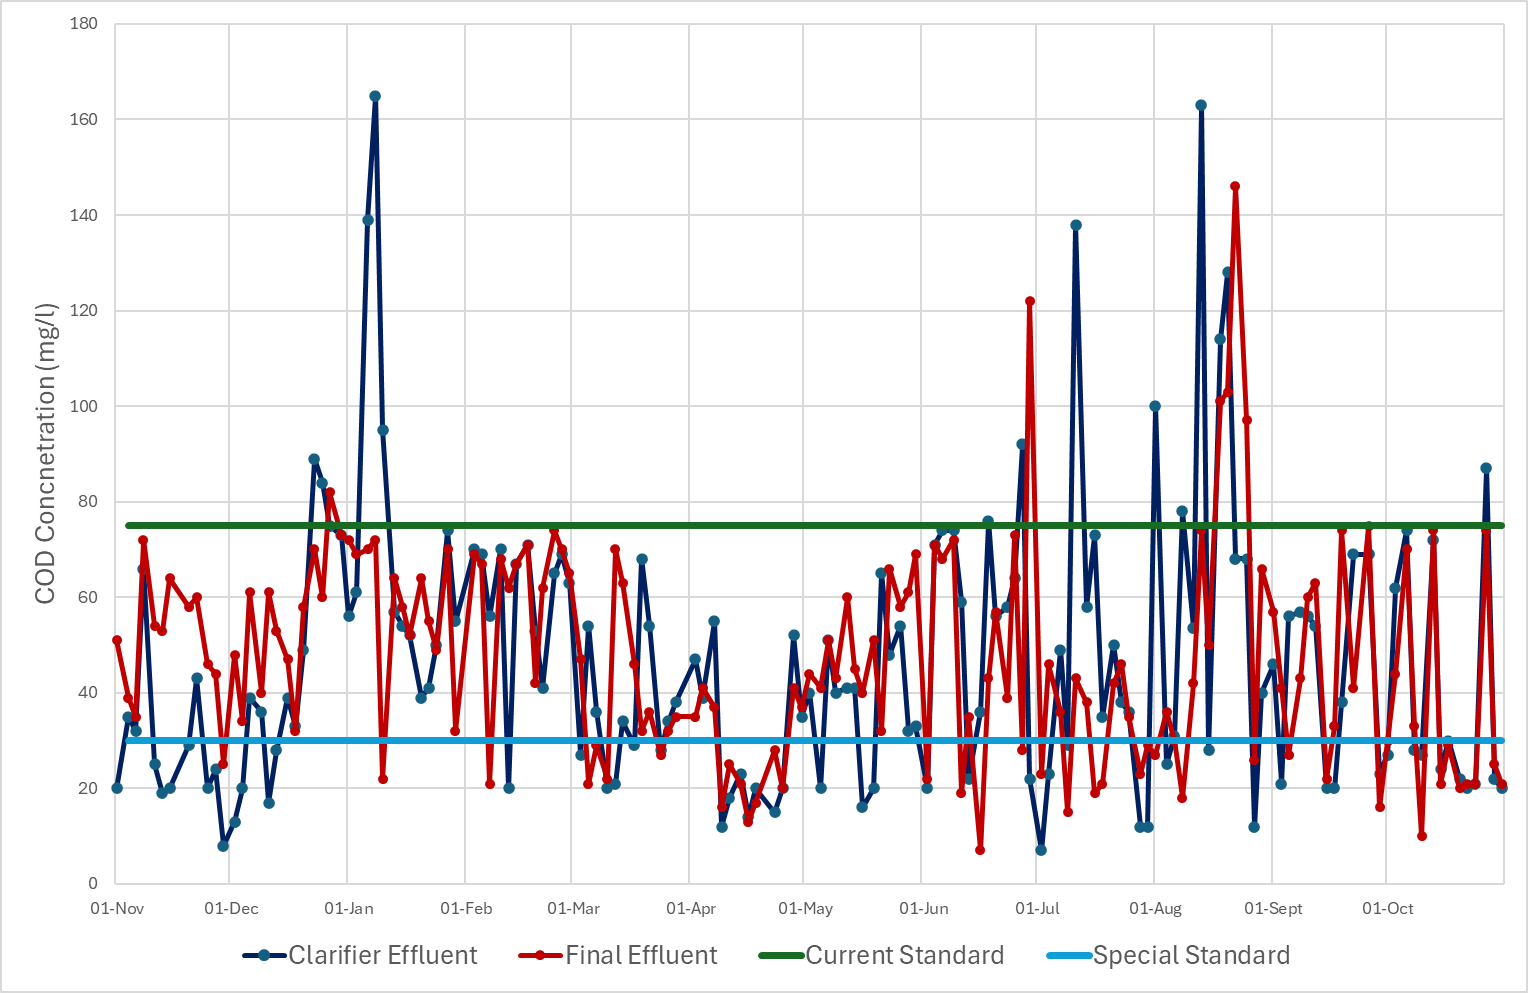
Figure 7: Daily Effluent COD Concentrations
The following should be noted:
- The clarifier and final effluent concentrations are very similar, but the final concentration tends to be slightly higher. This is probably due to fermentation in the sludge layer in the maturation ponds.
- The final effluent COD concentration is generally below the current standard of 75mg/l, but well above the special standard of 30mg/l.
1.1.1. Effluent Ammonia
The effluent ammonia concentrations are presented below:
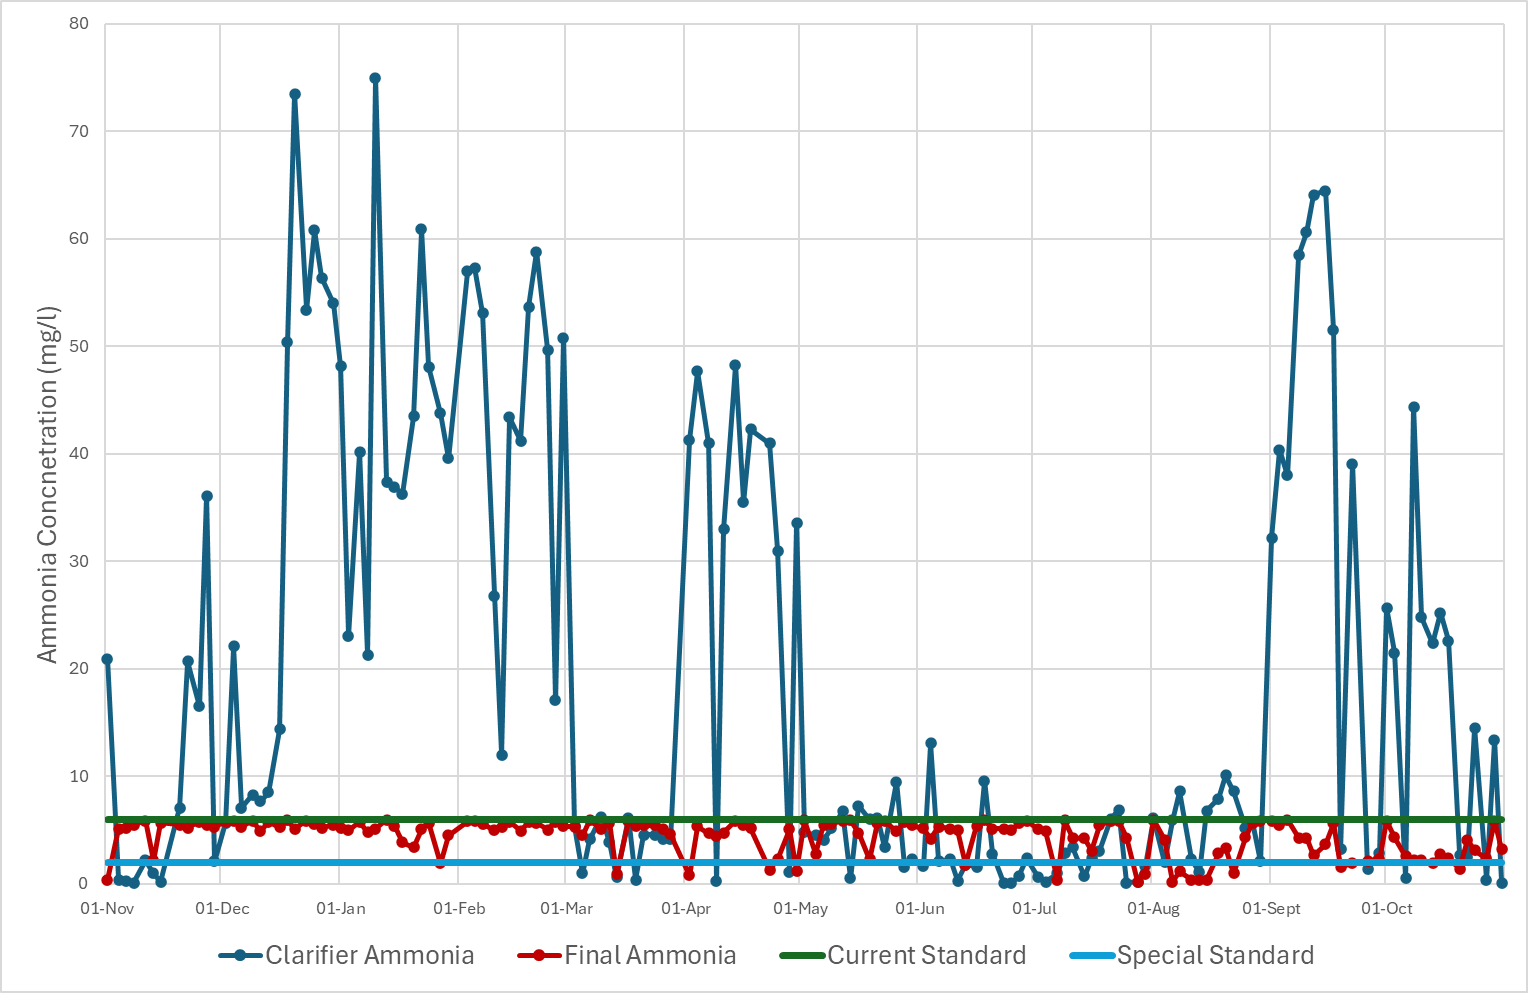
Figure 8: Daily Effluent Ammonia Concentrations
The following should be noted:
- The plant was designed to meet the special standard ammonia effluent concentration of <2.0mg/l and as a result this should be the target concentration leaving the clarifier.
- It will be seen that the clarifier concentration is significantly higher than even the more relaxed current standard of 6mg/l and this can only be attributed to a lack of aeration during these periods.
- The lack of aeration is almost certainly due to operator error, and it is known that one of the problems on the works is a chronic shortage of qualified staff.
- A basic requirement of plant control and operation is to regularly monitor the data being produced so that trends such as the loss of nitrification displayed by this data is detected as soon as it manifests itself so that it can immediately be corrected. Both the management and operating staff were very surprised when shown this data as they had not seen it before.
- It has been recommended that in future the laboratory technician generating the data should produce charts such as those shown in this report rather than simple spreadsheets and should immediately inform the operators and the management when parameters go out of specification. If possible, these charts should also be accessible live on operator’s computers so that they can monitor them in real time.
- It is significant that the ammonia concentration reduces significantly in the maturation ponds and that the final effluent is generally below the current standard of 6mg/l; it is not immediately obvious how this happens as the nitrification process of oxidizing ammonia to nitrate requires oxygen and aerobic nitrifying bacteria. One explanation is that some nitrification takes place within the maturation ponds and that the concentration is then brought done to its consistent level of approximately 6mg/l by oxidation with chlorine during the disinfection of the flow from the maturation ponds. If this is the case every effort should be made to rather reduce the concentration in the activated sludge plant because oxidation of ammonia with chlorine is expensive and interferes with the disinfection process.
- Nitrogen in the form of ammonia is a nutrient for the growth of plants and leads to the excess proliferation of emergent plants in the receiving stream and the dam on the Goose Valley Golf Estate from where it ultimately will enter the estuary.
1.1.1. Effluent Phosphorus
The effluent phosphorus concentrations are presented below:
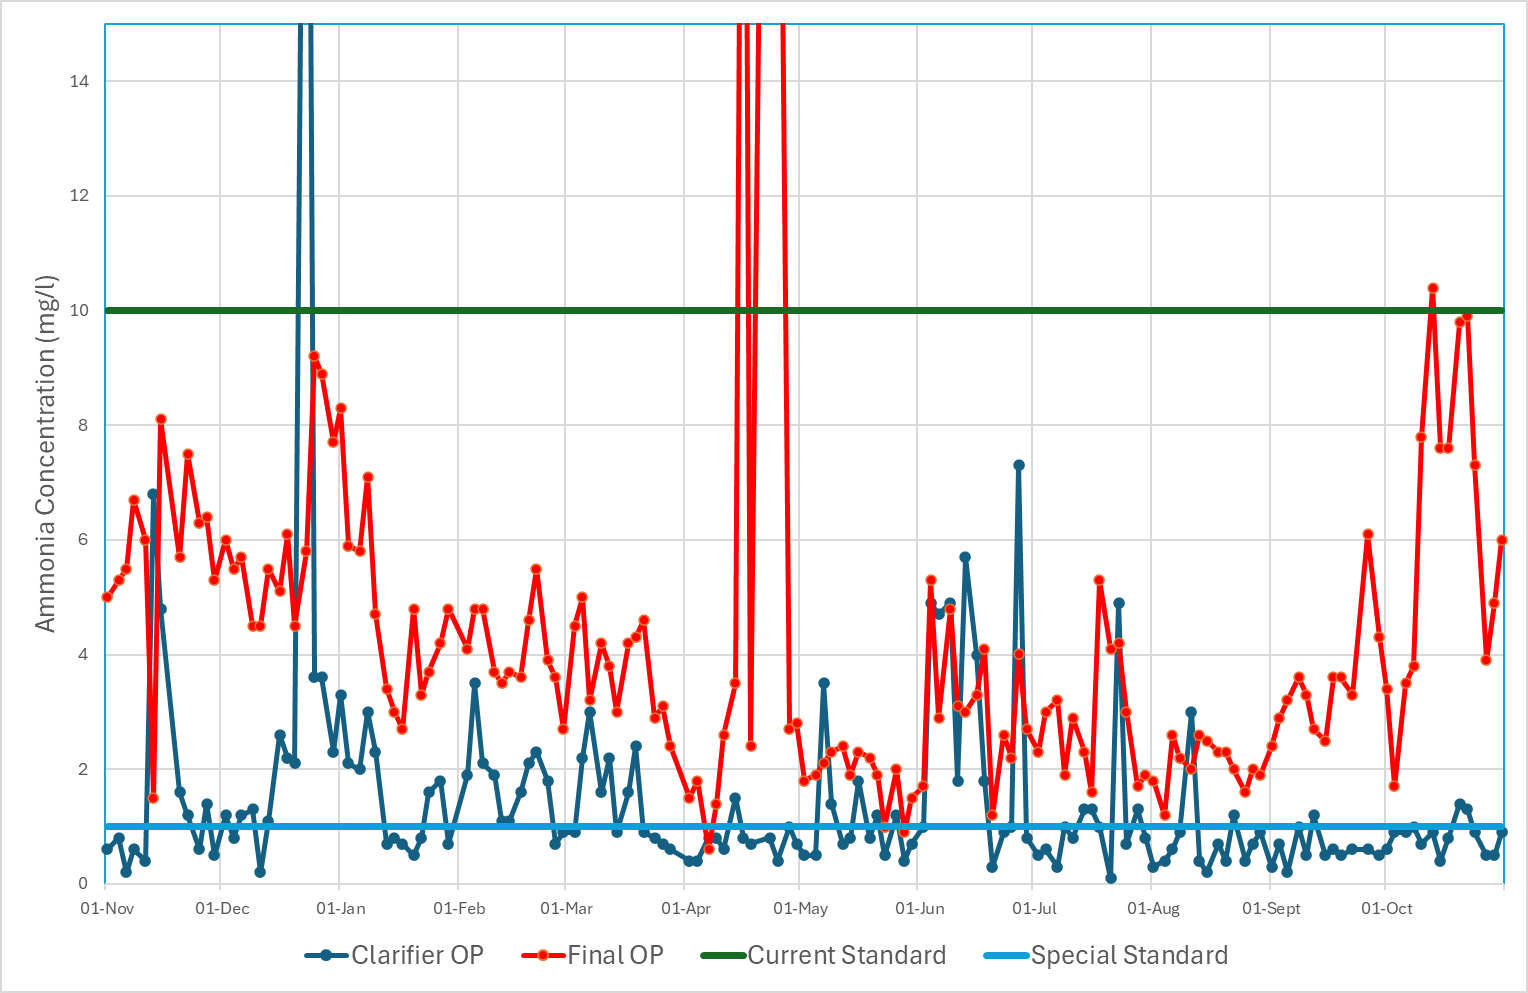
Figure 9: Daily Effluent Phosphorus Concentrations
The following should be noted:
- The plant was designed to achieve an Ortho P concentration of <1mgP/l and it will be seen that this is achieved for much of the time in the effluent leaving the clarifiers, but that the concentration in the effluent leaving the ponds is significantly higher over the period under consideration. This release of phosphorus is probably the result of fermentation in the sludge blanket in the maturation ponds.
- The periods when the clarifier effluent is significantly out of specification tend to coincide with the poor ammonia quality which is indicative of operator error.
- The final effluent leaving the plant is generally well below the current standard of 10mg/l but never below the special standard of 1mg/l.
- The main significance of the higher phosphorus concentration in the effluent reaching the stream is that it is also a nutrient for the growth of plants and leads to the excess growth of emergent plants in the receiving stream and the dam on the Goose Valley Golf Estate and ultimately could affect the quality of the water in the lagoon.
1. conclusion
The conclusions reached as a result of the foregoing analysis are presented below:
- Contrary to the influent data currently being provided, the works appears to be approaching full load and the planned extensions should be expedited as much as possible. There would appear to still be a certain amount of spare capacity available, but this should be used with circumspection, particularly until the analysis of the load is improved.
- An automatic sampler should be purchased as a matter of urgency to ensure that the data produced is indicative of the true load on the plant so that informed and rational decisions can be made on its capacity to accommodate additional property developments within its catchment area.
- Additional operation staff should be trained and employed urgently to ensure that the plant is operated optimally and produces acceptable effluent quality.
- The effluent quality should be monitored daily by both the management and the operating staff to ensure that it is operated optimally.
- A way to remove the sludge from the maturation ponds should be identified and implemented.
Plett Ratepayers' & Residents' Association
Help us hold Bitou Municipality to account
Reporting like this is powered by our members. Your subscription funds research, legal action and oversight — and every new member strengthens our mandate.